This page gives an overview of how the DRAGON data-acquisition is structured. This is intended to serve as documentation of the bit-packed structure of DRAGON event data, as well as the trigger logic and related topics.
DRAGON Hardware
The DRAGON data acquisiton consists of two separate VME crates, one for the “head” or gamma-ray detectors, and the other for the “tail” or heavy-ion detectors. Each crate is triggered and read out separately, and tagged with a timestamp from a “master” clock that is part of the head electronics. In the analysis, the timestamps from each side are compared to look for matches (events whose timestamps differ by less than a certain time window). Matching events are deemed coincidences and analyzed as such, while events without a match are handled as singles.
In the standard configuration, the head and tail DAQ systems read data from the following VME modules:
- Head
- One IO32 FPGA/control board.
- One CAEN V792 32-channel, charge-sensing ADC (or ‘QDC’).
- One CAEN V1190B 64-channel, multi-hit TDC.
- Tail
- One IO32 FPGA/control board.
- Two CAEN V785 32-channel, peak-sensing ADCs.
- One CAEN V1190B 64-channel multi-hit TDC.
Additionally, both sides contain a VME processor or “frontend” which runs the MIDAS data-acquisition code and is connected via the network to a “backend” computer (smaug) which performs analysis and logging (writing to disk) functions.
Trigger Logic
The following figure shows a simplified diagram of the trigger logic (identical for head and tail DAQs):
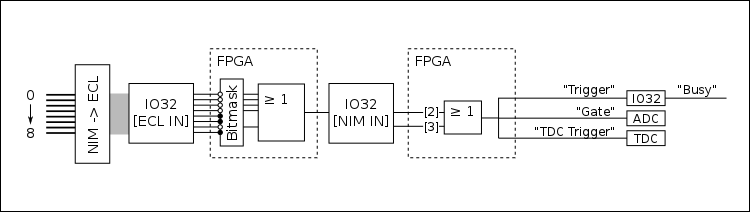
The logic starts with up to eight digital (descriminator) NIM signals being sent into a NIM -> ECL level converter. The output is then sent via a ribbon cable to the “ECL inputs” of the IO32. The eight signals are then processed in the IO32’s internal FPGA. First they are sent through a bitmask, where individual channels can be ignored by writing the appropriate bits to an FPGA register. This allows individual channels to be removed from or added to the trigger logic without physically unplugging/plugging in any cables. From here, the unmasked channels are ORed to create a single “master” trigger signal, which is output via a LEMO cable from the IO32. This signal is then routed back into the IO32 via one of its NIM inputs: it is sent into either NIM input 2 or 3. These two signals (NIM in 2 and 3) are ORed internally and sent through an FPGA logic sequence to generate three output signals:
- “Trigger”
- “Gate”
- “TDC Trigger”
The “trigger” signal is routed back into the IO32, where it sets off the internal logic to identify that an event has occured. This also prompts the generation of a “busy” signal which can be used to block the generation of additional triggers while the current event is processing. The arrival time of the “trigger” signal is also stored in an internal register, and serves as the “timestamp” to identify coincidence vs. singles events (more on this later). The “gate” signal is a NIM logic pulse with a programmable width, and it is routed into the ADC(s) to serve as their common integration or peak-finding window. The “TDC trigger” signal is also a NIM logic pulse, which can be delayed by a programmable amount of time. It is routed into the TDC, where it serves as the “trigger” (this is similar to a “stop” signal - the TDC will time pulses arriving within a programmable time window proceeding the arrival of the trigger).
Data Format
MIDAS
This section gives a brief overview of the MIDAS data format and, more importantly, how it is decoded for DRAGON data analysis. This is in no way exhaustive, and for more information, the reader should consult the MIDAS documentation page. Readers who are already familiar with the MIDAS data format may wish to skip to the MIDAS Banks section where the specifics of DRAGON data are discussed. For more information on MIDAS event structure, consult https://midas.triumf.ca/MidasWiki/index.php/Event_Structure.
MIDAS files are first organized into “events”. For DRAGON, each event corresponds to a single trigger of the VME system(s). The analysis code handles everything on an event-by-event basis: each event block is fully analyzed before moving onto the next one. This means that the analyzer code needs some way of obtaining the individual blocks of data that correspond to a single event. This is mostly handled using “library” functions provided as part of the MIDAS package - in other words, we let the MIDAS developers handle the details of grabbing each event’s data and simply incorporate the functions they have written into our own codes.
Events are obtained in different ways depending on whether we are analyzing “online” data (data that are being generated in real time and sent to the backend analyzer via the network) or “offline” data (data stored in a MIDAS [.mid] file on disk). For online data, we use a set of routines that periodically poll the frontend computer, asking if any new events have been generated. When the frontend responds with a new event, the corresponding data are copied into a section of RAM allocated to the analysis program (often called the “event buffer”). At this point, the data now are part of the analysis program, and can be further processed using a suite of specifically designed analysis routines. For offline data, we again make use of stock MIDAS routines to extract event data into a local buffer for analysis. However, here we are not asking for events in real time; instead, we are extracting them from a file consisting of a series of events strung together. To do this, we use a set of functions that understand the detailed structure of a MIDAS file and can figure out the exact blocks of data corresponding to single events.
Once we have obtained an event and stored it in a local analysis buffer, the next step is to identify the individual packets containing data from the various VME modules. Actually, there is one important step coming before this: the individual events are placed into a local buffer (a “buffer of buffers”) and, after a certain amount of time, pre-analyzed to check for coincidence matches. For more on this, see the coincidence matching section. As mentioned above, once we have a single, defined event, we need to break it down into packets or “banks” in order to analyze the data from individual VME modules. Each bank contains a header with some unique identifying information about the bank, and from there the actual bank data follow. In the header, each bank is identified by a unique 4-character string. All we have to do, then, is use library routines which search for banks keyed by their ID strings. If the corresponding bank is present within the current event, the routine will return a pointer to the memory address of the beginning of the bank, along with some other relevant information, such as the total amount of data in the event and the type of data being stored.
The actual data are simply a series of bits organized into constant-sized chunks. Each “chunk” is a unique datum (a number), corresponding to one of the C/C++ data types. Depending on how the data were written, each number could be the most basic source of information, summarizing everything there is to know about a given parameter, or it could be further sub-divided into smaller pieces of information given by the sequence of bits that make up the number within the computer. If the data are “bitpacked,” then typically the code will make use of bit shifting and bit masking operators to extrack the information from the desired bits (more on this in the example below).
The only way to know how to properly handle the data is to know ahead of time how the data were written and how their relevant information is written into the various chunks of data making up a MIDAS bank. A typical analysis code will loop over all of the data in the bank, and then decide how to handle it based either on foreknowledge of the exact bank structure or on information contained in specific bits within each word.
As an example, take a slightly modified version of the code to unpack V792 ADC data:
bool vme::V792::unpack(const midas::Event& event, const char* bankName, bool reportMissing)
{
bool ret = true; // return value
// Search for a MIDAS bank with the correct name (the value of the variable 'bankName')
int bank_len;
uint32_t* pbank32 = event.GetBankPointer<uint32_t>(bankName, &bank_len, reportMissing, true);
// pbank32 is now set to the address of the bank with name 'bankName'. We know ahead of time that
// the bank contains a set of longwords (uint32_t), and bank_len is now set to the number of longwords
// stored in the bank.
// Loop over all data words in the bank
for (int i=0; i< bank_len; ++i) {
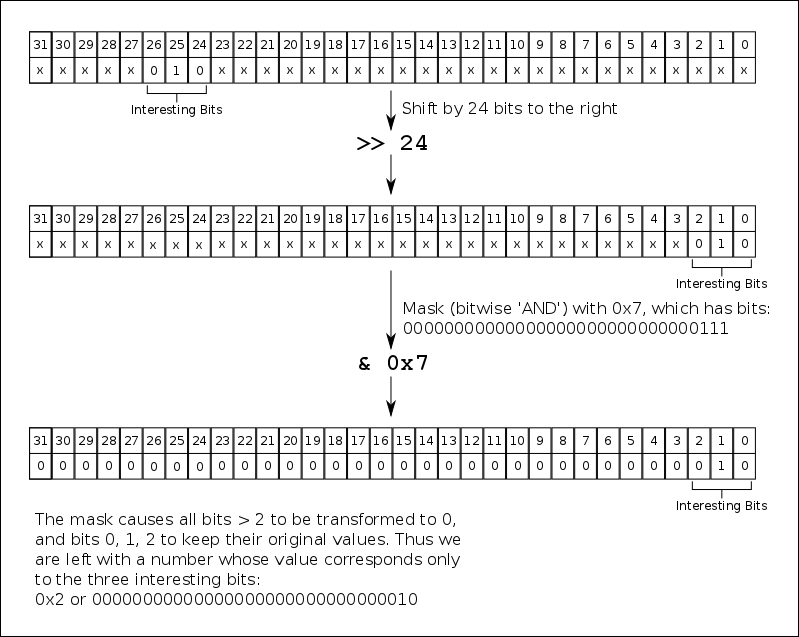
// Read bits 24, 25, 26 to figure out the type of data in this particular longword
uint32_t type = (*pbuffer >> 24) & 0x7;
// Now decide what to do based on the value of 'type'
switch (type) {
case 0x0: // Data bits
// Figure out the measurement value, copy into vme::V792 class data.
break;
case 0x2: // Header bits
// Read relevant header information and proceed.
break;
// ... etc for other data types ... //
default:
break;
} // Note: Somewhere along the line, set 'ret' to 'false' if there was an error.
}
return ret;
}
If you are unfamiliar with C/C++ bit shifting and masking, the line (*pbuffer >> 24) & 0x7 might be confusing to you. The basic idea is that you are taking the value of the 32 bits stored at the address pointed to by pbuffer (*pbuffer extracts the value) and first shifting it by 24 bits, then masking it with the value of 0x7, that is, extracting only the first three bits, which now correspond to bits 24, 25, 26 since *pbuffer has already been shifted by 24 bits to the right. Here is a figure to help visualize the process:
MIDAS Banks
The frontend codes generate four different types of events, with the following characteristics:
- “Head Event”
- Event Id: 1 (or DRAGON_HEAD_EVENT in definitions.h)
- MIDAS Equipment:
HeadVME - Trigger condition: OR of all BGO channels
- Banks:
- “VTRH”: IO32 data
- “ADC0”: V792 QDC data
- “TDC0”: V1190 TDC data
- “TSCH”: Timestamp counter data from the IO32
- “Head Scaler Event”
- Event Id: 2 (or DRAGON_HEAD_SCALER in definitions.h)
- MIDAS Equipment:
HeadScaler - Trigger condition: polled once per second
- Banks:
- “SCHD”: Scaler counts (for the current read period, ~1 second)
- “SCHS”: Scaler sum (since the beginning of the run)
- “SCHR”: Scaler rates (counts/second for the current read period)
- “Tail Event”
- Event Id: 3 (or DRAGON_TAIL_EVENT in definitions.h)
- MIDAS Equipment:
TailVME - Trigger condition: OR of all heavy ion detectors
- Banks:
- “VTRT”: IO32 data
- “TLQ0”: V785 ADC data (unit 0).
- “TLQ1”: V785 ADC data (unit 1).
- “TLT0”: V1190 TDC data
- “TSCT”: Timestamp counter data from the IO32
- “Tail Scaler Event”
- Event Id: 4 (or DRAGON_TAIL_SCALER in definitions.h)
- MIDAS Equipment:
TailScaler - Trigger condition: polled once per second
- Banks:
- “SCTD”: Scaler counts (for the current read period, ~1 second)
- “SCTS”: Scaler sum (since the beginning of the run)
- “SCTR”: Scaler rates (counts/second for the current read period)
CAEN V792/V785 ADC
The data format of CAEN V792 charge-sensing and CAEN V785 peak-sensing ADCs is exactly the same; in fact, identical code is used to write and to analyze the data stored by each module. A single event from a V792/V785 is organized into 32-bit “longwords”. A generic event looks something like this:
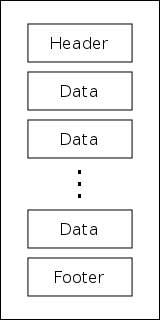
starting with a header longword, followed by a series of data longwords, and finishing with a footer longword. Each of these longwords contains multiple pieces of information given by individual series of bits within the longword. The bit structure and purpose of each type of longword is as follows:
Header
The header longwords give specific information about the module and the current event. The data are sub-divided into bits as follows:
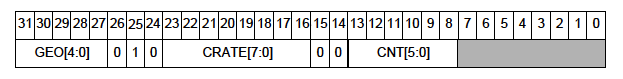
- Bits 0 - 7: Unused
- Bits 8 - 13: Identify the total number of data longwords in the event.
- Bits 14 - 15: Unused
- Bits 16 - 23: Identify the “crate number” of the present module (ignored for DRAGON experiments).
- Bits 24 - 26: Uniquely identify the longword as a header, that is, all headers have the sequence 0 1 0 for these bits.
- Bits 27 - 31: Identify the “geo address” of the present module (ignored for DRAGON experiments).
Data
The data longwords tell the actual measurement value of a specific channel, that is, they tell what the integrated charge or maximum height of the signal going into a single channel is. Data longwords are arranged as follows:
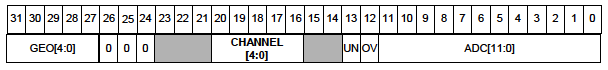
- Bits 0 - 11: Encode the measurement value for the channel in question. Note that since this is an 12-bit number, the measurement values can be within the range [0, 4095] (or [0x0, 0xfff]).
- Bit 12: Single bit telling if the channel in question was in an overflow condition (signal larger than the maximum). ‘1’ corresponds to a channel that is in overflow, ‘0’ to one not in overflow.
- Bit 13: Same as bit 12, except it tells if the channel is in an _under_flow condition (below a certain threshold).
- Bits 14 - 15: Unused.
- Bits 16 - 20: Encode the number of the channel in question, i.e. if these bits evaluate to 5, we are reading input channel five, and so on.
- Bits 21 - 23: Unused.
- Bits 24 - 26: Uniquely identify the longword as a “data” word: all data words have the sequence 0 0 0 for these bits.
- Bits 27 - 31: Copy of the “geo” address from the header.
Footer
The main purpose of footer lngwords is to provide a counter for the total number of events received during a run.
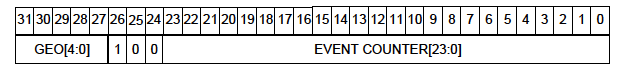
- Bits 0 - 23: Event counter, increments automatically every time a new event is read.
- Bits 24 - 26: Ideitify this longword as a footer; all footers have the sequence 0 0 1 for these bits.
- Bits 27 - 31: Copy of the “geo” address.
Finally, in addition to the types mentioned above, a longword can also be an invalid word, which is IDed by 0 0 1 for bits 24 - 26. An invalid word typically signifies some sort of error condition within the ADC.
CAEN V1190 TDC
The structure of a V1190 TDC event is somewhat similar to that of a V792/V785 ADC: each event consists of a series of longwords, with the general structure of [Header], [Data], [Data], …, [Data], [Footer]. In addition, there is also a “global” header attached to each event. Unlike the V792, we do not necessairily have only a single data longword per channel; this is because the V1190 is a “multi-hit” device, that is, it is capable of registering multiple timing measurements if more than one pulse goes into a given channel during recording of an event. Additionally, the user may set the TDC to record the time of both the front and the back of a given pulse, and each of these will count as a different “hit” on the channel.
Below are the bit packed structures of the various types of longwords that can be read from a V1190 TDC. Note that the V1190 is a rather complex device and can run in varying operating modes. The documentation below is only relevant in the “trigger matching” mode, which is how DRAGON operates. For information about other running options, consult the manual (available online from the CAEN website).
Global Header
The global header contains an event counter and some other common information about the module.
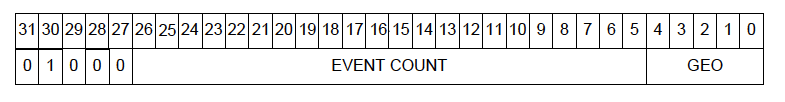
- Bits 0 - 4: “Geo” address (unused for DRAGON).
- Bits 5 - 26: Event counter.
- Bits 27 - 31: Identify the longword in question as a global header with the unique sequence of 0 0 0 1 0 for these bits.
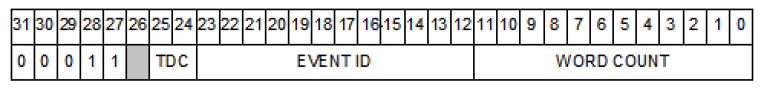
TDC Header
The (optional) TDC header contains information about a apecific TDC trigger.
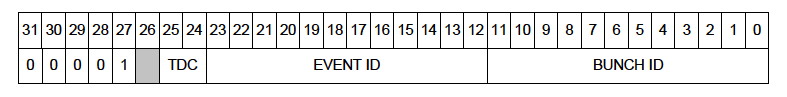
- Bits 0 - 11: Encode the bunch id of the trigger.
- Bits 12 - 23: Encode the event ID.
- Bits 24 - 25: TDC code (unused for DRAGON).
- Bit 26: Unused.
- Bits 27 - 31: Identify the longword in question as a TDC header by having the sequence 1 0 0 0 0.
Measurement
A measurement longword contains the information of a single timing measurement made by the device.
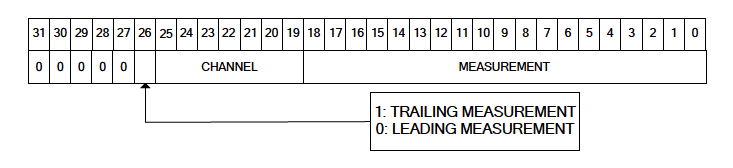
- Bits 0 - 19: Encode the measurement value. As an 19-bit number, this allows measurements in the range
[0, 524287](or[0x0, 0x7ffff]). - Bits 19 - 25: Encode the channel number of the measurement in question.
- Bit 26: Tells whether the measurement in question is a trailing-edge measurement (‘1’) or a leading-edge measurement (‘0’).
- Bits 27 - 31: Identify the longword in question as a measurement by having the sequence 0 0 0 0 0.
TDC Trailer
The (optional) TDC Trailer provides some additional information about a TDC trigger.
- Bits 0 - 11: Count of the number of words read from the trigger.
- Bits 12 - 23: ID code of the trigger.
- Bits 24 - 25: TDC code (unused for DRAGON).
- Bit 26: Unused.
- Bits 27 - 31: Identify the longword in question as a TDC trailer by having the sequence 1 1 0 0 0.
Global Trailer
The global trailer contains some information that is common to all events.
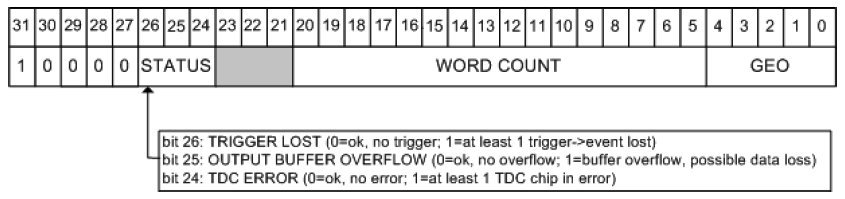
- Bits 0 - 4: “Geo” address of the module (unused in DRAGON).
- Bits 5 - 20: Number of words currently read.
- Bits 21 - 23: Unused.
- Bits 24 - 26: Encodes the status of the current event. If all three bits are zero, then we are in a “no error” condition. For the various “error” conditions and the bits that signal them, consult the figure.
- Bits 27 - 31: Identify the current longword as a global trailer via the sequence 0 0 0 0 1.
Error
This type of longword is only present if the TDC is in an error condition.
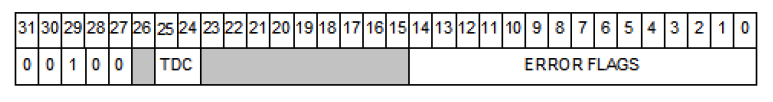
- Bits 0 - 14: Encode the error status. Each bit that is set to ‘1’ signifies a unique error condition:
- 0: Hit lost in group 0 from read-out FIFO overflow.
- 1: Hit lost in group 0 from L1 buffer overflow
- 2: Hit error have been detected in group 0.
- 3: Hit lost in group 1 from read-out FIFO overflow.
- 4: Hit lost in group 1 from L1 buffer overflow
- 5: Hit error have been detected in group 1.
- 6: Hit data lost in group 2 from read-out FIFO overflow.
- 7: Hit lost in group 2 from L1 buffer overflow
- 8: Hit error have been detected in group 2.
- 9: Hit lost in group 3 from read-out FIFO overflow.
- 10: Hit lost in group 3 from L1 buffer overflow
- 11: Hit error have been detected in group 3.
- 12: Hits rejected because of programmed event size limit
- 13: Event lost (trigger FIFO overflow).
- 14: Internal fatal chip error has been detected.
- Bits 15 - 23: Unused.
- Bits 24 - 25: TDC code (unused for DRAGON).
- Bit 26: Unused.
- Bits 27 - 31: Identify the current longword as an error word via the sequence 0 0 1 0 0.
IO32 FPGA/Control Board
Data from the IO32 FPGA/control board are written into two separate MIDAS banks. The first bank contains information about the trigger conditions generating the present event. It consists of nine 32-bit longwords, and each longword, save for one, corresponds to a single piece of information about the trigger (i.e. no sub dividing into bits as with the CAEN modules). The nine longwords read from the trigger bank are as follows:
- Header and version number of the IO32.
- Number of triggers (starting with zero) since the beginning of the run.
- Timestamp marking the arrival of the trigger signal.
- Timestamp marking when the data readout began.
- Timestamp marking when the data readout ended.
- Trigger latency: the difference in timestamps between the trigger and the start of the readout.
- Readout elapsed time: the difference in timestamps between the end of the readout and the start of the readout.
- Busy elapsed time: the difference in timestamps between the end of the readout and the trigger.
- Trigger latch value: This is the only bitpacked value in the IO32 trigger bank. The first eight bits in the longword signify which of the eight input channels generated the trigger. Whichever bit is true is the channel making the trigger. For example, a value of 0x4 [ bits: 00000000000000000000000000000100 ] means that input 3 generated the trigger.
The other bank consisting of IO32 data is the timestamp counter (TSC) bank. This bank contains timestamp information for both the event trigger and other programmable channels (such as the “cross” trigger, or the trigger of the other DAQ, if it is present). It is here that we look to identify which events are singles events and which are coincidences. The actual TSC data are stored in a FIFO (first in, first out) with a maximum depth set by firmware limitations. Any pulses arriving beyond the limits of the FIFO are ignored.
The TSC banks are arranged as follows (all 32-bit unsigned integers).
- Version number (firmware revision tag).
- Currently ignored other than a check that the version numbner is a known one.
- Bank timestamp (time at which the TSC bank was composed).
- Currently ignored.
- TSC routing bits (sets TSC signal routing for the frontend)
- Ignored for analysis.
- TSC control
- Contains the following bitpacked information:
- Bits 13..0 - Number of TSC words in the FIFO
- Bit 14 - FIFO overflow marker
- Bits 21..15 - Upper 8 bits common to each TSC in the FIFO.
- Contains the following bitpacked information:
- Upper bits rollover
- Firmware limits each TSC measurement to 38 bits, which rolls over in ~3.8 hours. Runs could occasionally go longer than this, so we manually count the number of rollovers in the upper 8 bits in the frontend code and write it here.
- FIFO (depth given by TSC control as noted above)
- Each entry is bitpacked as follows:
- Bits 0..29 - Lower 30 bits of the timestamp entry (combine with upper 8 bits plus upper bits rollover marker)
- Bits 30..31 - Channel marker (0,1,2,3) for this TSC measurement
- Each entry is bitpacked as follows:
- Overflow marker: additional word
== 0xFFFFFFFFis written if the TSC is in an overflow condition.- Currently ignored because TSC control gives the same information.
Coincidence Matching
An important topic related to the TSC bank is the method used to identify singles and coincidence events. As analysis of real-time, online data is quite important for DRAGON experiments, we need a method that is able to handle potential coincident head and tail events arriving at the backend at relatively different times. Since, as mentioned, MIDAS buffers events in the frontend before transferring to the backend via the network, events from each side are received in blocks. Potantially, coincident events could be quite far separated in terms of “event number” arriving at the backend.
The method used to match coincidence and singles events is to buffer every incoming event in a queue, sorted by their trigger time values. In practice, this is done using a C++ standard library multiset, as this container was shown to be the most efficient way in which to order events by their trigger time value. Whenever a new event is placed in the queue, the code checks its current “length” in time, that is, it checks the time difference between the beginning of the queue (the earliest event) and the end of the queue (the latest event). If this time difference is greater than a certain value (user programmable), then the code searches for timestamp matches between the earliest event and all other events in the queue. Note that a “match” does not necessairily mean that the trigger times are exactly the same, as this would imply that the heavy ion and γ-ray were detected at exactly the same time, which is impossible for a real coincidence since the heavy ion must travel for a finite amount of time (~3 μs). Thus, we define a “match” as two triggers whose time difference is within a programmable time window. Typically, this window is made significantly larger than the time difference of a true coincidence (~10 μs), and further refinements can be made later by applying gates to the data.
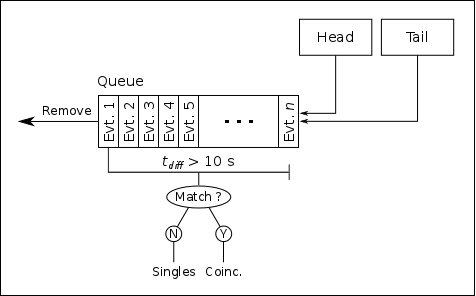
If a match is found, then the two events are analyzed as coincidences, and the earliest event is removed from the queue. If no match is found, the earliest event is analyzed as a singles event and then removed from the queue. As long as the maximum time difference is set large enough to cover any “spread” in the arrival times, this algorithm should guarantee that every coincidence is flagged as such.