Getting Started
Computers
Most of the data acquisition software runs on the ‘smaug’ machine. This is a “headless” Mac tower that resides in the DRAGON counting room. Since it doesn’t typically have a monitor or keyboard attached, access is achieved remotely, using ssh or vnc. ‘smaug’ is intended to be a dedicated DAQ machine, with as much of its computing power as possible going towards data acquisition tasks. This means that you should not run non-essential programs on ‘smaug’ during an experiment or any time important data are being collected.
The primary computer used for experiment-related tasks (e.g. histogram display, EPICS control, looking things up on the web, etc.) is daenerys, which is the dual-monitor iMac residing in the DRAGON counting room. From here, you can also ssh or vnc into ‘smaug’ to perform DAQ related tasks.
Startup Script
In order for any data acquisition tasks to be possible, a minimum set of programs must be running on ‘smaug’. These programs can be started by logging into the machine and running the following script:
start_daq.sh
Note that this may be run from any directory as its location is part of the default search path. You will need to run this script any time ‘smaug’ or one of the VME crates is rebooted/power-cycled, or any other time a “fresh” start of the DAQ system is needed. You may also try running start_daq.sh in case of failure of some part of the system, as it will restart every essential program, possibly solving any software-related problems.
Once start_daq.sh has been run, it is possible to perform any standard DAQ-related tasks using the MIDAS web interface, as explained in the next section.
Midas Control Page
Like many experiments at TRIUMF, the DRAGON DAQ runs the Maximum Integrated Data Aquisition System (MIDAS) software. This page give a brief overview of MIDAS, but is in no way exhaustive. However, MIDAS is extensively documented, so the reader is encouraged to explore the resources found here for questions not answered here and/or to familiarize oneself with the software.
DRAGON experiments can be controlled using a web interface. This can be accessed from any browser by visiting the following address: http://smaug.triumf.ca:8081. You will be redirected to the secure DRAGON MIDAS web server and prompted for credentials (if you don’t know the DRAGON credentials, contact an experienced DRAGON experimenter to find out). The experiment control page should look something like this:
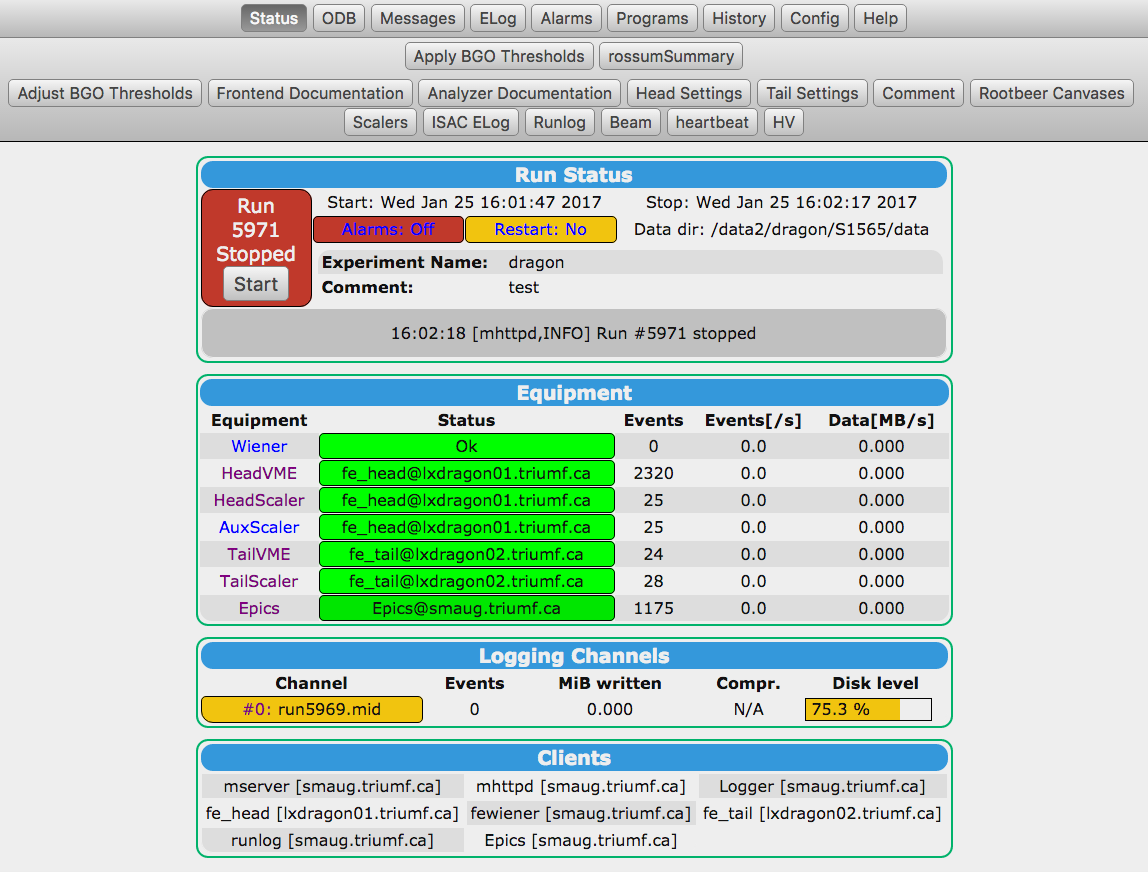
Most of the navigation can be done using the buttons at the very top of the page, and at any time you can always return the home page by clicking the “status” button, which should be present in MIDAS experiment page (except the home page itself). A few of the buttons are rarely utilized, so here I’ll just go through the ones that commonly tend to see use.
-
Start [Stop]: This button starts or stops a run. In order for it to have the desired effect, essential programs must already be running, as explained in later sections.
-
ODB: This allows the user to read or modify online database (ODB) parameters relevant to the experiment; for more information, see the dedicated ODB section.
-
ELog: This allows the user to write entries in an electronic logbook. Navigation and construction of an elog entry is fairly intuitive. DRAGON typically does not keep paper logbooks during experiments, so it is essential that any important information be recorded in the MIDAS elog.
-
Alarms: Allows the user to configure alarms, which can be tripped if certain experimental conditions are met. The alarms can perform a variety of functions, from giving an audible or visual warning to emailing or SMS messaging the appropriate persons. Configurations of alarms is somewhat advanced and recommended only for experienced MIDAS users.
-
Programs: The MIDAS web interface allows users to start and stop essential programs within the browser. You may have noticed that much of the screen is green on the experiment home page displayed above. This is an indication that essential experiment programs are running–the green areas would be red otherwise. Clicking on the Programs button will allow you to start or stop these programs as needed. After clicking on the Programs button, you should be brought to a page something like this:
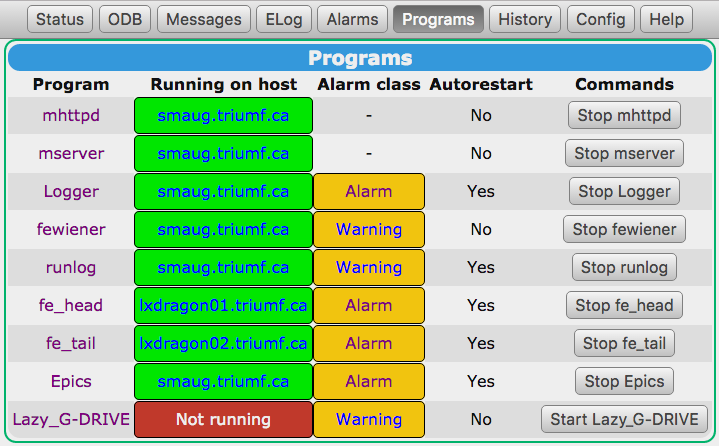
Currently running programs will be displayed as green and not running programs as red. To start or stop programs, click the corresponding “Start xxx” or “Stop xxx” buttons. The programs you’ll be able to control from this page are all important in ensuring proper data taking; here is a bit of explanation about what each one does:
mhttpd: This is the MIDAS html server. It can only be started or stopped from a terminal, not from the webpage, because the webpage would not exist if it wasn’t running!Logger: This program performs any logging functions encountered in MIDAS, including the very important function of saving event data to disk! TheLoggerprogram should be kept running at all times. Note that one can still choose to not save event data even with theLoggerprogram running.fe_head: This is the “head” (BGO/gamma-ray) frontend program - that is, the program which controls the VME crates and modules used for data acquisition in the head setup. It must be running for any gamma-ray data to be collected, and generally should be kept running at all times.fe_tail: Identical tofe_head, except for the “tail” or heavy-ion setup.Epics: The Epics program interfaces via the MIDAS slow control bus (mscb) protocal to poll DRAGON EPICS data from the EPICS Input/Output Computer (DRAIOC). The program is set to poll 398 EPICS channels every 20 s. The polling frequency can be altered (if necessary to ease the load on DRAIOC) under the /Equipment/Epics/Common subtree. The /Equipment/Epics/Settings subtree can be extended if inclusion of additional Epics channels becomes necessary.
Occasionally, you might run into issues with starting and stopping programs from the experiment homepage. Often, the status indicator will refuse to become green, or will turn red after a short amount of time. This indicates that the program is crashing or having some sort of other problem. Diagnosis of the problem typically requires one to turn to the terminal to get more information about what’s going on. To do this, first find out what computer the program actually runs on by looking at the “Running on host” column. Then fire up a shell and log into that machine using ssh. If it is one of the frontend programs that is giving you trouble, often the problem is that there is more than one instance of the program running on the host, which is bad since each will attempt to communicate with the VME crate in ways that very likely will conflict. To check if this is happening, first click on the hotlinked program name on the MIDAS page, and then look at the “Start command” field to figure out the actual name of the program that is running. Then, in the shell do the following (for, e.g. fe_head) :
ps ux | grep fe_head.exe
If there are multiple instances running, you will see something like this:
dragon   11980  0.0  0.2  24224  1336 ?        Ssl  10:36   0:02 online/src/fe_head.exe -D
dragon   11527  49.7 0.2  24236  1484 ?        Ssl  12:20   0:01 online/src/fe_head.exe -D
dragon   13840  0.0  0.1   5500   648 pts/0    S+   12:17   0:00 grep fe_head
perhaps with more than one /online/src/fe_head.exe -D entry. If this is the case, you should kill all running instances. You can kill individual process using the UNIX kill command and the process ID as follows:
kill 11980
where 11980 indicates the process ID. Then do ps ux | grep fe_head.exe again to check if it worked. If not, try again with the -9 flag:
kill -9 11980
It is extremely rare that the kill -9 command will not succeed in terminating the program. Note that if there are many instances of a program running, you can attempt to kill all of them in one go:
killall -9 fe_head.exe
If the problem isn’t multiple instances of a frontend program running, then it’s likely that the program in question has a bug that needs to be found and fixed. Debugging C/C++ programs is more of an art than a science and well beyond the scope of this manual. However, one can often get useful information by running the program in a terminal rather than through the MIDAS page, since running in the terminal allows error messages to be seen by the user. To do this, click on the hotlinked program name to figure out the executable, log into the appropriate machine, and run it from a terminal. If it crashes, take note of any error or warning messages, as these may prove essential in quickly figuring out what the problem is.
ODB
The MIDAS data-acquisition system makes use of an online database (ODB), allowing users to specify parameters which are relevant to their experiment. ODB parameters are stored in a directory-like hierarchy, to allow grouping of the various parameters in a logical way. This section gives an overview of the available parameters for DRAGON experiments.
Accessing the ODB
The DRAGON odb can be accessed either from the web or from a terminal1. To access via the web, visit the DRAGON experiment home page at: http://smaug.triumf.ca:8081. You will be redirected to the secure DRAGON experiment MIDAS webpage. If this is your first time accessing the online MIDAS server (or if you haven’t saved the credentials), you will be prompted to enter the DRAGON credentials. After doing so, click on the “ODB” link button near the top of the page. From here, you should see a variety of links that you can follow to descent into the ODB hierarchy. To access the odb from a terminal, log into the ‘smaug’ machine at TRIUMF:
ssh dragon@smaug.triumf.ca
and issue the following command:
odbedit
This starts a shell program from which you can read or modify ODB parameters. Use of the odbedit program closely mirrors that of a UNIX terminal; to see a list of available commands type help while in the odbedit program.
Equipment Configuration Parameters
This section gives an overview of the various “Equipment” parameters in the ODB. These parameters control various aspects of the VME hardware that are important in the setup of an experiment. There are two sets of parameters, for the head and tail systems. The head and tail settings are accessed under the paths /Equipment/HeadVME/Settings and /Equipment/TailVME/Settings, respectively. From here, the parameters are grouped according to the VME modules which they control.
V812 [head only]
The V812 settings parameters control the operation of the pair of CAEN V812 constant fraction discriminators (CFDs) used for the BGO detectors. The available options are:
-
Threshold: Sets the threshold values for the individual CFD channels. This parameter is an array of 32 integers, and each array element determines the threshold value of the corresponding CFD channel. Note that in the DRAGON setup we have two CFDs, each with 16 input channels. Array elements [0, 15] control channels [0, 15] on the first CFD, while elements [16, 31] control channels [0, 15] on the other. The number written into the ODB corresponds exactly to the threshold value in millivolts, i.e. specifying a value of 100 for index [0] will set a threshold of 100 mV in CFD channel 0 (actually, the threshold would be -100 mV since the CFDs accept negative pulses). Valid threshold settings must be in the range [1, 255].
Typically one does not adjust individual thresholds in the ODB, as there is a program available to set all threshold values at a level corresponding to a specific γ-ray energy. This can be done either from a shell or from the MIDAS status page. To run from a shell, run the executable:
/Users/dragon/online/thresh/thres <gamma energy>where the sole argument is the desired γ-ray energy in keV. To change thresholds from the status page, first click on the “Adjust BGO Thresholds” button near the top of the page. Then change the “Threshold Gamma Energy” parameter to correspond to your desired minimum gamma energy in keV. Then go back to the status page and click the “Apply BGO Thresholds” button to make the new threshold values take effect.
Note: See the README file in/Users/dragon/online/odb/for a brief explanation of how the threshold values are determined from a desired minimum γ-ray energy. -
OutputWidth: Sets the width of the CFD output pulses. When a given CFD channel receives a valid analog signal, it generates a logic pulse, with the leading edge indicating the time at which the signal arrived. The width of this signal is programmable via the OutputWidth parameter. The widths are common to groups of eight channels: OutputWidth[0] controls channels [0, 7] on the first CFD, OutputWidth[1] controls channels [8, 15] on the first CFD, and so on. The ODB settings must be in the range [0, 255], which corresponds to actual pulse widths from 11 - 240 ns in a non-linear way:
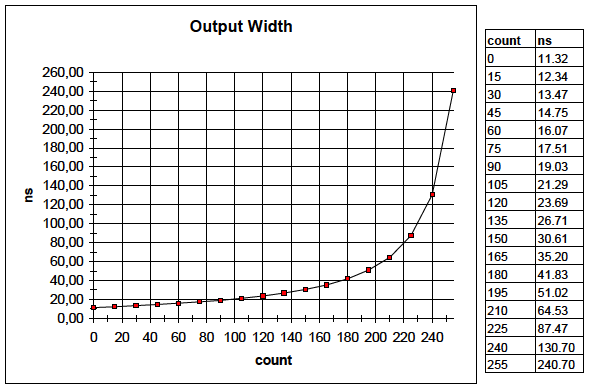
Typically, for DRAGON experiments we are not concerned with output pulse widths, as only the leading-edge of is utilized in any meaningful way. The only requirement is that the pulses be wide enough to trigger any subsequent digital electronics; typically the ODB values are set to a value of 200, which corresponds to a width of a bit over 50 ns.
-
DeadTime: Sets the minimum dead time between hits, again in groups of eight channels in the same way as the OutputWidth. The dead-time sets a required minimum time between pulses before a given channel can be re-triggered. Note that the actual dead-time value will be the larger of the OutputWidth or the DeadTime settings. The ODB value can be in the range [0, 255], with 0 corresponding to a 150 ns dead time, and 255 to 2 μs. Unfortunately, the V812 manual does not specify how dead-times are determined for intermediate values, so if precise intermediate values are required one will have to contact CAEN or another expert for more information, or figure it out empirically.
Currently, the dead times are set to the maximum value of 2 μs [255]; however, it is worth giving some consideration to setting this lower as it potentially could provide information about cases where multiple gammas interact in a single BGO crystal.
-
MajorityThreshold: Sets the number of required channels to generate a ‘MAJ’ pulse. In addition to producing logic pulses channel-by-channel, the V812 can generate output pulses depending on some function of >= 1 channel. One of these outputs is the ‘MAJ’ or “Majority” pulse, which is only generated if the number of CFD channels receiving a signal is above a certain number (referred to as the “majority level” or MAJLEV). The value of MAJLEV is set by the MajorityThreshold ODB parameter, in groups of 16 channels (i.e. the majority level is common to a full CFD). The number entered into the ODB corresponds to a majority level according to the following equation:

where NINT means the nearest integer, and MAJTHR is the ODB value. For reference, here is a table listing MAJLEV and MAJTHR values:
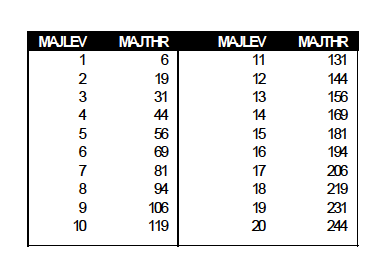
In typical operation, the majority thresholds are both set to 6, corresponding to a majority level of 1. This effectively causes the MAJ output to be a duplicate of the ‘OR’ output, which fires whenever one or more channels receives a signal.
-
PatternRegister: Enable or disable specific CFD channels. This is an array of two integers which set the enabled channels in each of the two CFDs. Each entry is a 16-bit bitmask, that is, the enabled channels are determined by which of the 16 bits are ‘1’ within the number. A value of 0xffff (hex) enables all channels, 0x0 disables all channels, 0x3 enables only channels 0 and 1, and so on. Valid ranges are [0x0, 0xffff] (or [0, 65535] in decimal). If you need help figuring out the bits corresponding to a given number, run the
bitprintprogram ondaenerys.triumf.ca:bitprint <number>where
numbercan be specified in either decimal (n) or hex (0xn) formats. The output is the 32-bit pattern making upnumber; for determining PatternRegister values, you can just look at the lower 16 bits and ignore the upper 16 (which should all be zero if you entered something in the range [0x0, 0xffff]). Alternatively, google will translate numbers into binary simply by typing, e.g. “0xffff in binary” in the search bar.
For more information about the operation of the various VME modules, refer to their respective manuals which are available either online at the CAEN website or on draco.triumf.ca in the /Users/dragon/Documents/Manuals directory.
IO32
The IO32 settings configure the IO32 control boards utilized in both the head and tail setups. The IO32 is a general-purpose VME module manufactured in-house at TRIUMF. It includes an Altera Cyclone FPGA, allowing a wide variety of digital logic functions to be performed inside the unit. A number of FPGA features are employed in the DRAGON experimental setup, and their configuration is controlled by the following ODB parameters:
-
Pulser_enabled: Enable or disable pulser output. The IO32 includes an optional pulser feature, which can generate a continuous square wave at an arbitrary frequency. The pulser output can be enabled or disabled via this setting, with y corresponding to the pulser being enabled.
-
Pulser_rate: Set the pulser rate; the argument is the desired frequency in Hertz.
-
Tdc_delay: Sets the delay time for the TDC trigger. Whenever an event triggers the DAQ of a given side (head or tail), the IO32 will generate a “TDC trigger” signal to be fed into that side’s TDC, prompting the TDC to make a measurement. Due to limitations of the CAEN V1190 TDCs employed in the setup (see the subsequent V1190 section for more information), the TDC trigger signal must arrive after all measurement channels (effectively making it a “common stop”). Thus the TDC trigger signal must be delayed with respect to the initial signal generating the trigger, in order to allow time for signals from all measurement channels to arrive at the TDC. The length of this delay is controlled by the IO32 Tdc_delay parameter. The argument is an integer that corresponds to the desired delay time in nanoseconds.
-
Adc_width: Like the TDC trigger, the ‘gate’ signal sent into the ADC(s) originates from the IO32, being generated whenever the system is triggered by an event. This ODB parameter sets the width of the gate pulse, which is common to all ADC channels on a given side (head or tail). The argument is an integer specifying the desired gate width in nanoseconds.
-
InternalVeto: Turns on/off the vetoing of triggers received while busy. The IO32 has the option to veto any potential trigger signals that might arrive while the module is busy. This option can be turned on or off by setting the InternalVeto ODB parameter (y == internal veto enabled). Note that in the standard wiring configuration, this setting must be y; otherwise there is no protection against multiple triggering, which could potentially lead to errors. In order to safely turn off the internal veto feature, one must rig up some external logic to ensure that additional triggers cannot arrive while the system is busy processing a prior event.
-
ChannelEnable: Determines which inputs are fed into the system trigger. For both the head and tail systems, the trigger is generated from an OR of up to eight signals (IO32 ECL inputs [0, 7]). The ChannelEnable array allows the user to decide which of these eight inputs are turned on: setting a given array element to y allows signals from the corresponding ECL input to be part of the trigger. Note that it is a good idea to turn off any channels which are not expected to receive valid data during an experiment; for example, if the Ion Chamber is being utilized instead of the DSSSD, the DSSSD input should be off. This ensures that electronic noise cannot result in spurious triggers.
-
TSC_route: Sets which input channels are routed into the timestamp counter FIFO. Each entry sets the corresponding input channel as one of the TSC4 inputs. Values [0, 15] set NIM inputs and [16, 31] ECL inputs.
Note: In the standard operating mode, only the first array entry is anything valid (i.e. any channel that normally recieves a signal). This is always set to1: the trigger input channel. At times, it may be desirable to set one of the other input channels to0, which is the “cross trigger” signal. However, this is not done by default due to the finite depth of the TSC FIFO. If one system is running at a very high rate and the other a very low one, inputs from the high rate system can “swamp” the FIFO on the low rate one; in other words, every time the low rate system is read out, the TSC4 FIFO will be full of inputs from the other side’s triggers. This is a problem as potential coincidences can be lost: if the FIFO is already full at read time, then there is no room for the actual trigger time and thus nothing to compare to look for coincidences. For this reason, the standard running mode is to “disable” the cross trigger signal from going into the FIFO.
V1190
The V1190 settings configure the operation of the CAEN V1190 TDCs. Note that the V1190 is a rather complicated device, with a wide variety of potential settings. Only a small subset are dynamically configured using the ODB, with the others being “hard coded” in the frontend source codes. This is to avoid overwhelming the experimenter with too many options; however, if it is determined that a certain TDC feature needs to be changed, it is advisable to introduce dynamic control of that feature using the ODB, rather than leaving it hard coded and requiring the frontend codes to be re-compiled in order to introduce changes.
Before listing the available ODB settings, it is probably useful to give a brief explanation of the V1190 TDCs, to put the settings in a better context. This all assumes that the TDC is being run in “trigger match” mode, which is how the device should be run in any conceivable DRAGON experiment. In this mode, the TDC must receive a trigger signal to prompt the recording of time measurements for each of the 64 available channels. When the TDC receives a trigger, it looks for pulses arriving at each of the channels within a programmable “match window”. Only the times of pulses arriving within this match window are digitized and stored in the device. A graphical representation of this mode of operation is shown below (the reject and extra search margins can be ignored for the purposes of this document - they are hard coded in the frontend code):
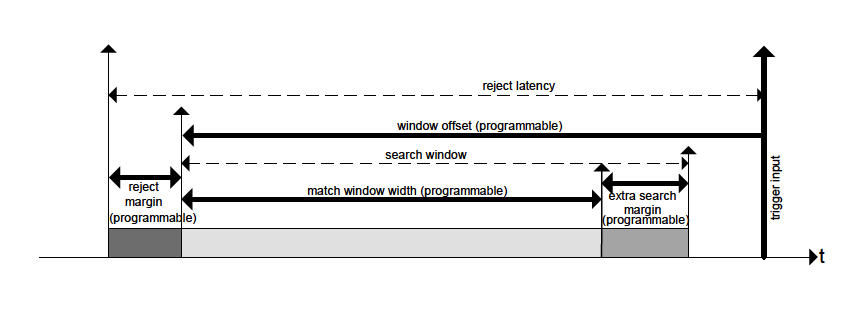
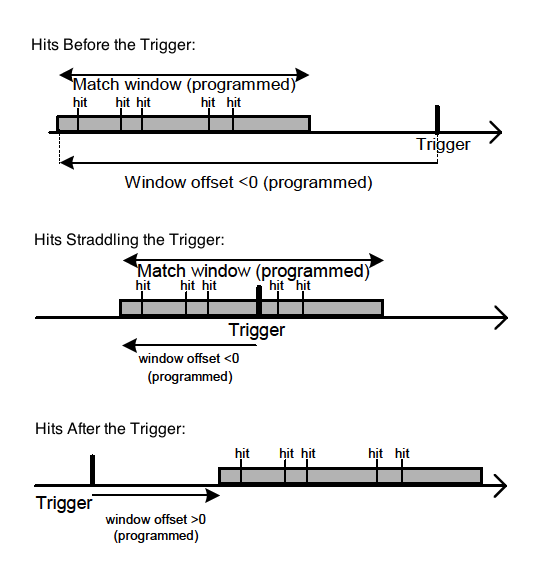
As indicated in the above figure, the width of the match window and its offset with respect to the trigger are both programmable values. The relative placement of the window w.r.t. the trigger is somewhat arbitrary, and it is allowed to precede, straddle, or follow the trigger:
However, there are some important limitations regarding the match window size and placement. In cases where the window straddles or comes after the trigger, the following condition must be fulfilled:
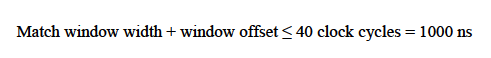
This means that the match window width cannot be > 1 μs in this configuration. If the window completely precedes the trigger, then the conditions on its width are much less stringent:
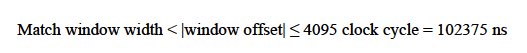
In this mode, then, it is possible to have a very large match window, with possible values > 100 μs.
The V1190 ODB settings are mostly related to the match window, as explained below.
-
TriggerSubtract: Sets the reference value of time measurements. When set to y, the recorded time measurements are all taken with respect to the beginning of the match window; in other words, a measurement value of 500 ns would mean that 500 ns have passed between the beginning of the match window and the arrival of the measurement pulse. When set to n, time measurements are taken with respect to the latest “bunch reset” (consult the manual for an explanation of this).
Typical operating mode for DRAGON is to set this value to y. However, one should be aware that the trigger signal fed into the V1190 contains a jitter of 10 ns due to the arbitrary delay introduced in the IO32 FPGA (the delay is generated by counting cycles of a 100 MHz clock, so it’s only good at the level of a clock period). Thus when time measurements are taken w.r.t. the jittery trigger, they also contain a 10 ns jitter. However, since this jitter is common to all channels, it can be removed in software by simply subtracting two time measurements from each other. In typical operating mode, the OR of the eight ECL inputs that make up the system trigger are fed into a TDC measurement channel. This signal is jitter-free, and thus provides a good time reference that can be subtracted from all other channels.
-
MatchWindow/Width: Sets the width of the TDC match window. See the section above for what is meant by the match window width. The ODB setting corresponds to the desired window width in nanoseconds.
-
MatchWindow/Offset: Sets the offset of the TDC match window. This is the time between the beginning of the match window and the arrival pulse. The ODB parameter corresponds to the desired offset in nanoseconds.
Note: Currently, the frontend code utilizes a library function for communicating with the V1190 to set the match window parameters. This function ignores the sign of the number passed to it, treating every number as a negative. This has two consequences: 1) the sign of the ODB parameter is completely irrelevant - a value of10000is identical to-10000; 2) it is only possible to set match windows whose beginning precedes the trigger pulse arrival. For the time being, this is irrelevant as we must always run with a match window completely preceding the trigger (due to the fact that window widths > 1 μs are needed). If this changes in the future and match windows completely following the trigger are desired, the frontend code (in particular, v1190B.c) will need to be modified.The V1190 match window settings are closely related to the IO32
Tdc_delayexplained earlier, and typically all of these parameters must be set together. Since DRAGON needs time measurements spanning a range > 1 μs, it is necessary to delay the TDC trigger by an amount that guarantees that any measurement signal would arrive before it. So the first step is to set an IO32 Tdc_delay which is large enough for the purposes of the particular experiment–that is, set a delay that will guarantee that the window between the initial trigger and the TDC trigger ( = initial trigger + delay) will encompass any signals for which time measurements are required. Then, in order to catch the earliest measurement pulses, one should set a V1190 match window offset that is larger than the value of the trigger delay (typically it is a good idea to leave a few hundred nanoseconds of “padding” to ensure the earliest pulses are caught). The last parameter to set is the match window width, to a value that is smaller than the offset (as required by the device specifications). Finally, note that there is no particular advantage to setting tight measurement windows–readout busy time is dominated by reading measurement values from the individual modules’ memory rather than match window (or gate) widths. So when in doubt, it is likely better to set a larger window to guarantee catching all of the signals rather than a smaller one.
-
It is also possible to access the ODB directly from C or C++ code; for more information, see the odb function documentation. ↩